Our team at Amsterdam Data Collective, together with researchers from Erasmus University Rotterdam, worked on behalf of the Ministry of Health, Welfare and Sport to better inform regional dementia care policy makers in the Netherlands. We used data science techniques to build an integrated dashboard of anonymised data on patients with dementia and their caregivers. Overall, the dashboard provides insights on areas for improvement to ensure all people with dementia have access to high quality care and that their loved ones are well supported.
All Cases


Dementia Care: A Multidisciplinary Approach Lacking Integral Overview
The strategies of dementia care in the Netherlands are partly determined regionally. Therefore, the circumstances, needs, and wishes can be very different for people living in the countryside compared to people from larger metropolitan areas. Coordinators and policy makers for different regions indicated a desire to compare regions, allowing them to identify areas of improvement.
In addition, care for people with dementia requires a multidisciplinary approach. This includes cooperation between primary physicians, specialists, nurses, and long-term care facilities. Each of these specialised areas of care collects and maintains their own data. Furthermore, there is currently no integral overview across these disciplines.
The focus of this project was to collect and combine information from a wide variety of sources related to the different aspects of dementia care. This information was then put into a single, centralised dataset and dashboard. Overall, it allows regions to use data science insights to improve their dementia care.
Enhancing Dementia Care: A Three-Step Approach
We started our approach with design sprints to determine what insights were most relevant to the dashboard’s users. For this project, the primary users are the regional policymakers and coordinators who ensure all relevant healthcare professions cooperate in organising the regional dementia care. They determined that insights were needed on the integral patient pathway across healthcare professionals and the wellbeing of partners of people with dementia. Furthermore, they identified the opportunity to compare regions across a variety of metrics. Consequently, this allows regional coordinators to share lessons and learn from one another.
Next, we collected all the relevant available data and integrated it into a centralised dashboard. This data can now be used to provide insights on the different regions. For instance, it shows how many patients are in a long-term care institution per region. With a centralised dataset, the variances in regions become more apparent and the learning opportunities between regions increase.
Finally, we developed a prediction model to determine if we can predict which regions can expect a higher number of people with dementia due to demographic characteristics. By identifying the modelled number of people with dementia and comparing that to the actual number of people, regions can identify areas of improvement of their diagnostic policies. Our team at ADC is experienced in building prediction models in the healthcare sector.
Read more about our work on prediction models that uses a logistic regression: precision dosing for patients with Hashimoto’s thyroiditis.
Data-Informed Cross-Regional Learning for Collective Improvement
The first results of the dataset show that significant variance can exist between regions across the different healthcare disciplines. This variance is not necessarily unwanted; people with dementia living in different regions can require and desire different levels of care from the different healthcare professionals. However, shedding light on this variance allows similar regions with similar demographics, such as large metropolitan areas, to share approaches and policies to learn from one each other and collectively improve the care for people with dementia.
The first results of the dataset show that significant variance can exist between regions across the different healthcare disciplines. This variance is not necessarily unwanted; people with dementia living in different regions can require and desire different levels of care from the different healthcare professionals. However, shedding light on this variance allows similar regions with similar demographics, such as large metropolitan areas, to share approaches and policies to learn from one each other and collectively improve the care for people with dementia.
Subsequently, we are working towards identifying specific groups of people with an increased risk of developing dementia. For example, developing it through demographics, lifestyle, and comorbidities. By identifying these groups, primary physicians can pre-emptively inform them of their risk and perform regular screening tests to ensure a possible diagnosis can be made in the earliest stages of the disease. To achieve this, we have a large amount of information on people both with and without dementia; consequently, we must first discover the right set of characteristics that predict a future diagnosis. As we continue to improve the prediction model, the likelihood of identifying larger groups with more specificity increases.
Intuitive Dashboard: Visualising Results for Improvement Insights
Together with researchers from Erasmus University, our team at ADC built a dashboard that is publicly available on the website: Dementie in kaart (“dementia mapped”). The dashboard includes both a backend and frontend. The backend, which is comprised of a database and APIs, was built in a Python language (Django). The frontend, which connects to the backend, was built in a combination of JavaScript, CSS, and HTML (Vue).
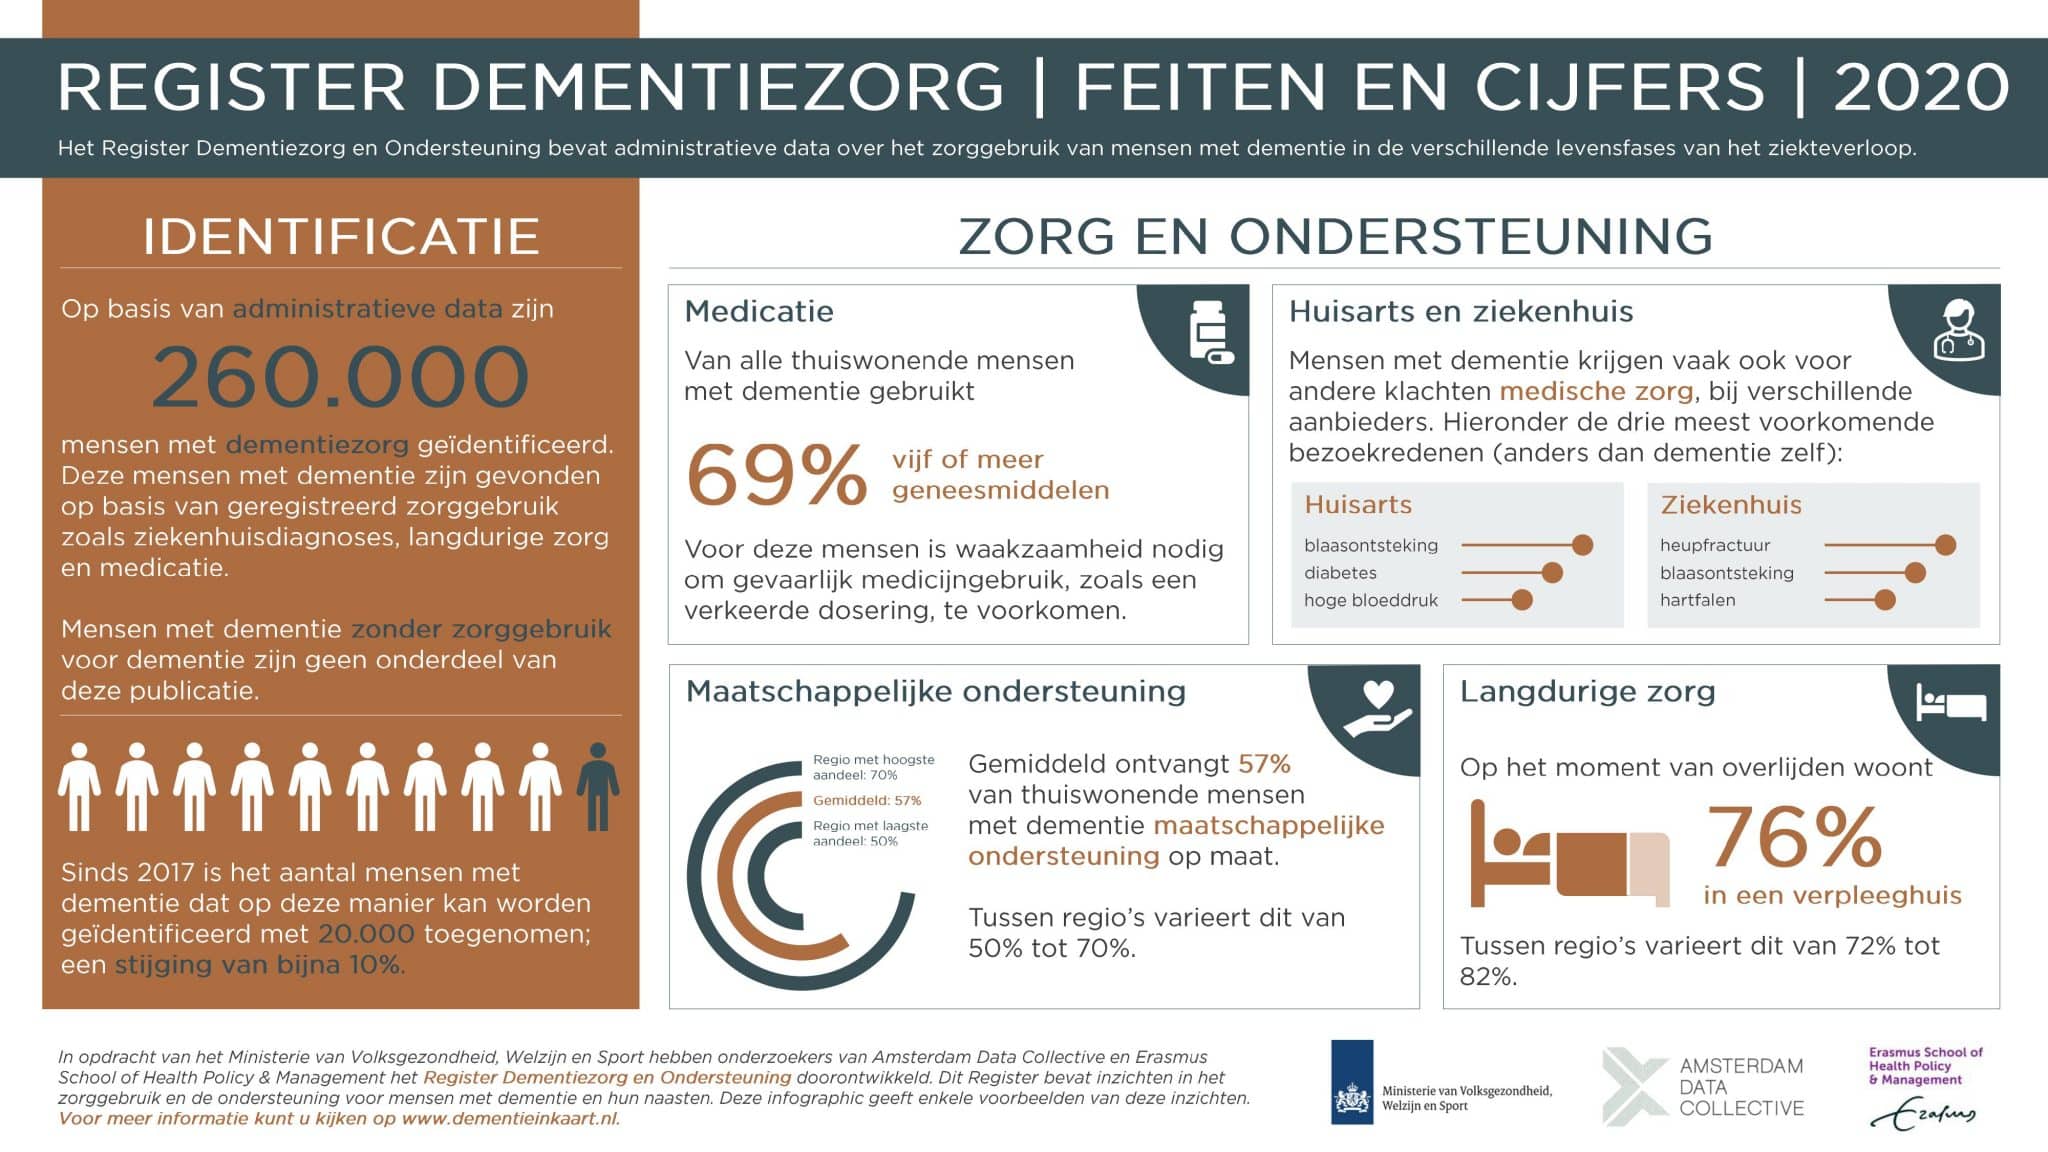
Furthermore, the dashboard contains descriptive information about the number of GP and hospital visits, the use of medication, social support from municipalities, and the use of long-term care. This data comes from various existing registrations that has been brought together. Collectively, this has identified 260,000 people with dementia care. Overall, it was an iterative process; we continuously updated the dashboard according to the feedback we received from regional policy makers on what data they wanted to see represented.
Curious about the numbers on dementia? Take a look at the infographic above (in Dutch) that includes a selection of the initial insights that are currently available. Find out more by visiting dementieinkaart.nl.
How can ADC help your healthcare organisation?
Fundamentally, a diverse skillset is necessary to successfully build a healthcare predictive model and dashboard. At ADC, we combine strategy, data engineering, and advanced analytics. Strategy is determined through the approach that starts with our signature design sprints; data engineering is used to collect the data and combine multiple sources; and advanced analytics informs how we make the predictive model to improve patient care.
Let’s shape the future
Do you want to know more? Get in touch with Hans van Avendonk of Amsterdam Data Collective, or check our contact page.

Related Cases


What stage is your organisation in on its data-driven journey?
Discover your data maturity stage. Take our Data Maturity Assessment to find out and gain valuable insights into your organisation’s data practices.